


DC United Goal Allowed Blame in 2024
A Metric of My Very Own

Unsatisfied with publicly-available advanced stats for defense, I took the dramatic step of creating my own statistic: goal blame. I went back through all 70 goals scored on DC in 2024 and for each one, I watched carefully and decided who I thought was at fault.
If you are skeptical about this enterprise, well, you’re right to be skeptical. But I’ll at least explain some details about how I approached this.
Sometimes it was easy to assign blame. Against Minnesota United, an opposing player heads a ball toward the DC United backline. It’s a routine play, but Christopher McVey misjudges the flight of the ball and lets it go over his head, allowing Tani Oluwaseyi to run in on goal. Even here, there’s a few judgment calls to make: Could Peltola react faster and intervene? Can Bono do better on the 1v1? I decided I blamed McVey entirely and awarded him with one entire “blamed goal” for his mistake. Peltola reacts as quickly as he reasonably can to this shocking gaffe and runs hard to try to get back. And as for Bono, even the best goalkeepers in the world frequently give up goals when a forward can just walk into a 1v1 like this.
Simple enough! One down, 69 goals to go.
There certainly were a number of goals where a single player is obviously at fault, but many posed trickier decisions. For example:

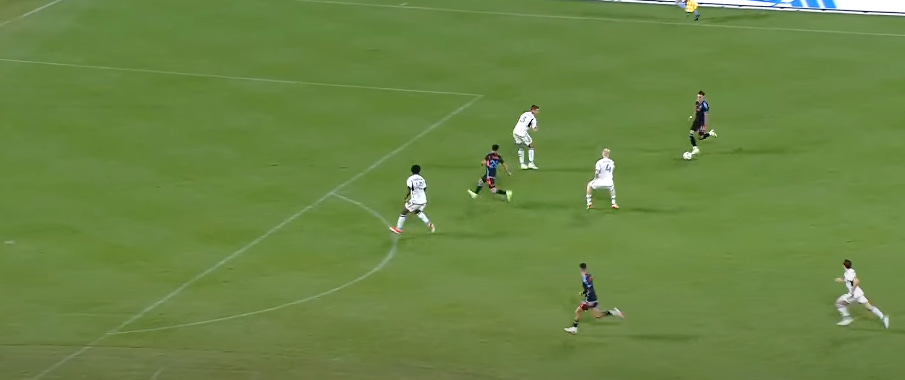
NYCFC is attacking in transition. Bartlett and Akinmboni are back with Peltola coming to help and Stroud trailing the play. NYCFC are about to pass it to Santi Rodriguez, unmarked on the bottom of the screen, for an easy goal. Who can we blame?
Looking at that screenshot, maybe you think Stroud should have gotten back faster to cover? In my opinion, Stroud’s role in the offense means he isn’t expected to be able to defend in transition like this. Note we have three players back, there’s three attackers, and yet they are about to put someone in alone on goal.
What about Peltola? Should he have seen the danger and swung wide to cover Rodriguez? Maybe! But my guess is that Akinmboni should be marking him. When you watch the entire play, you can see that as the sequence started, Akinmboni was closest to Rodriguez. As they run back, though, he drifts toward the first runner. If Bartlett was crashing toward the ball carrier, rotating this way would be the right answer and Peltola should notice and find the unmarked runner.
It’s a little hard to tell in that screenshot, but that’s not actually what Bartlett is doing. He’s playing conservatively and occupying space that allows him to cut off the passing lane to the runner:
Now look, I grant it’s just a tough situation all around, and if Akinmboni marked Rodriguez then maybe the ball gets slipped past Bartlett and Peltola to NYCFC’s lead runner and they score anyway. But Rodriguez ends up completely unmarked. That’s too easy.
And yet…from this discussion so far, you might think we were playing with Bartlett and Akinmboni as twin centerbacks in a back four. If that was true, you might wonder where the fullback was on that side. Could that be Stroud? He mostly played as a wingback or winger, but occasionally he put in a shift at fullback.
Actually, there aren’t any fullbacks, DC was playing with three centerbacks. Where is the third one? The way this sequence starts is that Pedro Santos turns over the ball deep in NYCFC’s half. The ball gets played forward, still well within NYCFC’s half, and McVey charges forward to try to win the ball back. He’s energetic but ineffectual, failing to win the ball, and then the ball is passed beyond him and everyone is off to the races in a chaotic 3v3.
Once again, there are judgment calls to make. Santos lost the ball. Should we blame him? I say no, he’s functioning as an attacker deep in the opposing half, we expect attackers to lose the ball a fair amount in those situations. McVey meanwhile is a centerback getting bypassed well into NYCFC’s half. That doesn’t seem right. Now maybe Lesesne wanted McVey to be aggressive trying to win the ball back immediately after turnovers. There were still two centerbacks left, after all.
Here’s where this happens:

Again a bit difficult to see, but McVey isn’t just flying in and missing. He’s actively being held off the ball with surprising ease by a young forward. Bad enough that he can’t win the ball, but he doesn’t foul either, allowing an easy pass out to the winger taking off down the sideline. And no, he wasn’t already on a yellow.
That makes me confident McVey bears some blame here, but there still were even numbers in defense. So you might assign things differently, but for this play, I gave Akinmboni 3/5 of the blame and McVey 2/5.
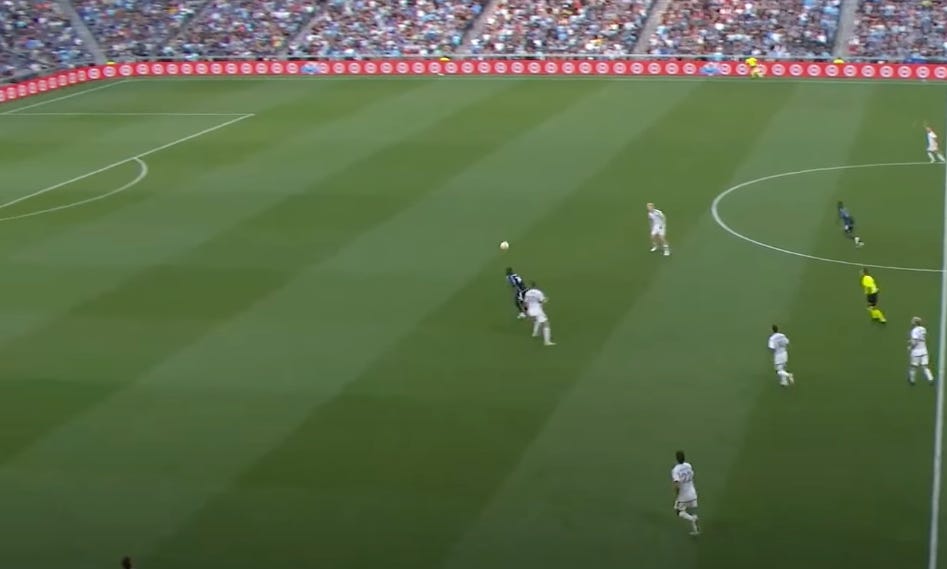
I’m sure I didn’t always make the right calls, but I hope you have some pity on me. It’s easy to nitpick, but I had to stare at plays like this and figure out who was to blame:

How could that possibly happen? On this play, which I had to watch a dozen times to understand, first Klich gets beaten ten yards inside DC’s half. Santos comes out and completely misses on his tackle. Not to be left out, Garrison Tubbs comes out and…completely misses his tackle.
For dramatic effect I cropped out the fact that Birnbaum, Bartlett, and Herrera were still behind the play, but there were four Toronto players coming at them. DC’s three remaining defenders proceeded to make (in my opinion) sensible decisions as to who to mark. Bernardeschi being Bernardeschi, he calmly looked up, saw who was marking who, and passed it to the fourth guy for an easy goal.
Lots of ways one might assign blame here. I gave 3/5 to Tubbs and 1/5 to Santos for the missed tackles. They both missed essentially the same tackle on the same guy, but Santos was playing wingback and is allowed to take a bit more risk. As a central defender, Tubbs has more responsibility. I also threw 1/5 of the blame on Jackson Hopkins because after holding back the closest runner in that first screenshot (not a bad decision, though the ref just called advantage), he just jogs backward and then watches Bernardeschi’s pass go right in front of him. Would a hard run have gotten him to where he can cut off the passing lane? We’ll never know, because he was jogging slowly in what was clearly an emergency situation.
Finally, there were a few goals where I simply couldn’t bring myself to blame any individual player, at least not entirely.
Sometimes this was because the goal just seemed like bad luck. For example, against Atlanta United, Matti Peltola tried to block a cross but it deflected off him such that Bono was helpless to keep it out of the net. Peltola did the right thing, but no one can block every cross. And deflection going right between the post and where Bono might have reached it? Just bad luck.
Another “bad luck” example was the very first goal of the season. In a way it wasn’t bad luck, it was Carles Gil being extremely good at the game of soccer and scoring a banger from well outside the box. I gave 1/5 of the blame to Santos for not closing him down faster, but come on, if you give even Gil ten of those, he’ll miss more than nine. It’s just bad luck that he managed to hit this just right in this instance.
There were also two goals where I assigned some blame to “set piece coach” because the other team did something that resulted in someone being wide open. One was Bedoya scoring by slipping past everyone on a free kick…I gave Murrell 2/5 of the blame for getting outrun by a player almost old enough to be his father but 3/5 of the blame on the set piece coach for a defensive structure where this was possible. And against Chicago, Andrew Gutman scored a banger when the ball came to him alone outside the box on a corner. I called that 4/5 bad luck, like the Gil goal. In this case, it was a sick goal, but also the only one Gutman scored all year! But I left 1/5 of blame for the set piece coach since surely someone should have been vaguely near him?
Goals Blamed: Caveats
After those examples, the following caveats are probably pretty obvious, but I want to state them anyway.
I’m not privy to the coaching the players receive, so sometimes they might look dumb, but it’s because they were diligently following dumb instructions from the coaches.
Anything like this could involve bias. I went into this thinking Bartlett was better than McVey and, lo and behold, the numbers bore that out. All I can say in my defense is that going through 70 goals, my mind was mush and I genuinely had no idea what the totals were for Bartlett, McVey, or anyone else until I was done and added everything up. Also, for what it’s worth, there were a lot of surprising results I definitely didn’t expect to learn going in.
Since I’m only looking at goals, the sample size isn’t as large as one would like. DC United did their best to help by giving up 70 freaking goals, but still, defenders have dozens of actions in a game. I think Bartlett is an especially good “emergency defender” in chaotic situations, the best on the team. But this stat only looks at actual goals the opposition scored, so he gets no direct credit for the desperation slide tackle that cleanly wins the ball or the shot saved off the line. Hopefully Troy Lesesne, Ally Mackay, and the other staff have access to more thorough stats that cover every opposing possession.
Four, as some of my examples showed, I’m weighting things such that defenders in general and players near DC’s goal in particular have more responsibility. This tends to let midfielders and attacking players off the hook. That’s unfortunate. I think Troy Lesesne would criticize this and say he expects all 11 players to be involved in defense. And that’s great, I just don’t have a good way to evaluate defensive actions—or lack thereof—farther upfield. Intuitively, I would tell you that Ted Ku-Dipietro is the best defender of the attacking players and that Gabriel Pirani is one of the worst…but this metric won’t help us evaluate that.
So there you have it. You probably got here from the 2025 preview or some other article deploying these stats, but since you made it all the way to bottom I’ll drop the 2024 figures for you to see:
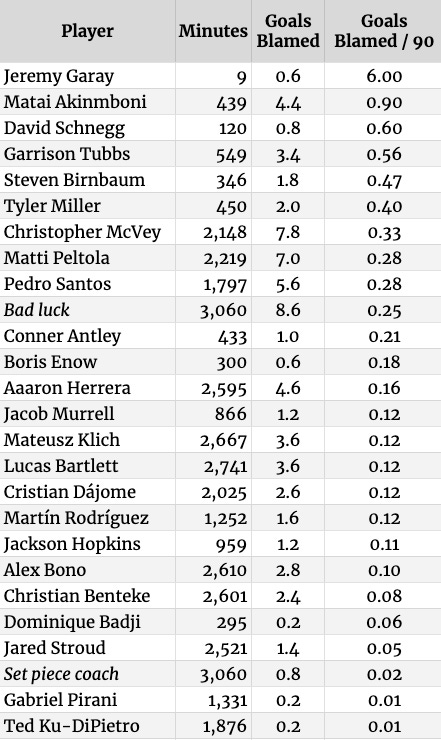
While kinda subjective this is very disheartening at first glance, then again it also makes sense that the defenders who play LCB or CB on the left side would receive the most blame since their LWB or LB was, more often than not, playing out of position or not a left back of any time. I'm sure there are some metrics out there like an inverse of Goals Added but we don't have access to that (maybe reach out to ASA).
Outside of that, I suspect some further standardization would be in order for next year. For the love of all things holy, do not subject yourself to watching all 70 goals against again. Maybe try to do it for each game in 2025.
My suggestion would be to look at each involvement (I'd create a standardized table for each type of error, reaction, positioning, choice, player tracking, etc.) which would have a value of 'potential goal blame'. These involvements would also vary in weight by position (zones?) in the field and number of non-GK players behind the ball (I'd weight this exponentially higher at 0 and 1). After giving each player their dings for each goal involvement, then it would be normalized to a decimal out of 1.
But just I'm a lunatic that's been developing a spreadsheet for schedule toughness based for the past 3 years.